
Currently viewing
Menu
Tafel Extrapolation
A Three Electrode Cell is again used for this Direct Current (DC) Test. The sample is polarized between approximately 0.200V cathodic to Ecorr - and approximately 0.200V anodic to Ecorr.
This type of Test would generate
experimental results similar to the
Anodic Curve and Cathodic Curve
shown in the Figure below.
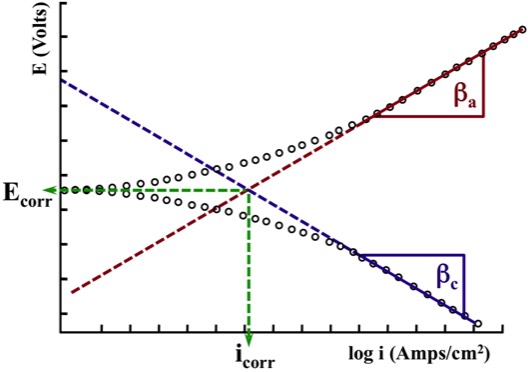
A computer running electrochemical software is used to locate the linear section of this experimentally generated Anodic Curve, as well as the linear section of this experimentally generated Cathodic Curve.
The Anodic Linear Section and the Cathodic Linear Section are extrapolated to find the intersection at Ecorr and icorr.
Once icorr is known, it is possible to define the Corrosion Rate.
The Anodic Tafel Slope (βa) and the Cathodic Tafel Slope (βc) are also defined, and can be used in subsequent experiments.
The shape of the Tafel area is a direct result of the fact that it is not possible to measure either the Anodic Current or the Cathodic Current independently during an electrochemical test. It is only possible to measure the difference between the anodic and cathodic currents.
At any specific Potential (E), the difference between
the Anodic Current and the Cathodic Current is:
"the Measured Current"
At any specific Potential (E)
the difference between the
Anodic Current and Cathodic Current
is "the Measured Current"
The anodic and cathodic currents are the same at Ecorr - where the curves intersect. This results in a measured current difference approaching zero.
As the voltage is polarized in the anodic direction, the Cathodic Current decreases. At the same time, the Anodic Current increases. Thus, the cathodic current progressively exhibits less influence on the anodic current - and the measured current moves closer to the anodic curve. As we continue to polarize in the anodic direction, a point will come when the influence of the cathodic current is negligible - and the experimental results will then fall on the anodic curve. This results in a linear section of the Tafel test, and gives us the Anodic Tafel Constant (βa).
If we now run the same experiment in the cathodic (negative) direction, the difference between the anodic and cathodic currents is again zero at Ecorr. As we cathodically polarize a sample, the Anodic Current decreases - while the Cathodic Current increases.
The anodic current progressively exhibits less influence on the measured current and moves closer to the cathodic curve. Eventually the measured current falls on the cathodic curve, which results in a linear section. We can then define the Cathodic Tafel Constant (βc).
Currently viewing
Page last updated: 3/4/25