
Currently viewing
Menu
Unit 8 - Thermodynamics
It is important to have some idea of the response of a metal to its environment. Thermodynamics is a science that can be used to gain some insight into the possibility of corrosion developing.
In the field of corrosion, Thermodynamics usually takes the form of a Pourbaix Diagram. The late Marcell Pourbaix (1904-1998) - a Belgium scientist - developed the Potential-pH Diagram (E-pH Diagram), which is frequently referred to as the "Pourbaix Diagram".
Advantages of Pourbaix Diagrams
➤Indicate stable species.
➤Indicate possible or impossible reactions.
➤Indicate thermodynamic driving force.
Limitations of Pourbaix Diagrams
➤Most are at room temperature.
➤Do not provide information on the rate.
➤Assume pure, unstressed, defect-free metal.
➤pH refers to the interfacial, not the bulk pH.
Basic Interpretation of the Pourbaix Diagram for Al-H2O:
An Al-H2O Pourbaix Diagram (Aluminum-Water Pourbaix Diagram) - at a concentration of 1x10⁻⁶ g-eq/L (gram equivalents per liter) - is presented below. This concentration is assumed to represent negligible corrosion.
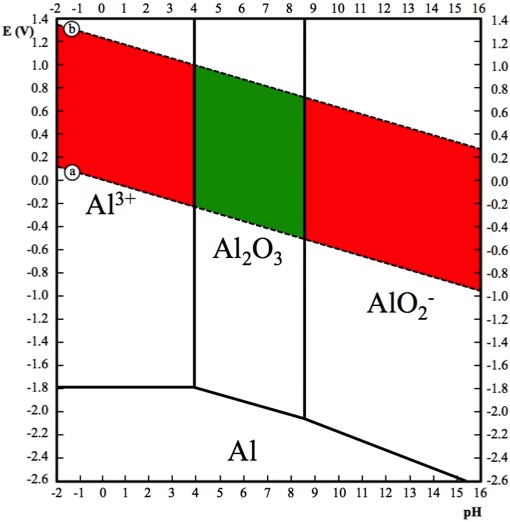
The two Dashed Lines (Line a and Line b) represent the domain of thermodynamic stability for water. The region between Line a and Line b represents the thermodynamic situation for aluminum in natural aqueous environments.
➤Water is stable between Line a and Line b.
➤Hydrogen Gas is stable below Line a.
➤Oxygen Gas is stable above Line b.
Aluminum is referred to as "amphoteric" because it is susceptible to corrosion in both acidic and basic environments. From the Diagram above, we can say that in aqueous environments aluminum is:
➤Resistant to corrosion between the pH values of approximately 3.9 and 8.6 - shown in green.
➤Susceptible to corrosion at pH values above 8.6 or below 3.9 - shown in red.
For more information on a practical use for Pourbaix Diagrams during a research project:
D.B. Mitton et.al. "Interpretation of the Rationale for Feed Modification in SCWO Systems"
J. Electrochem. Soc., p. L59 (1996).
For more information
on a practical use for
Pourbaix Diagrams
during a research project:
D.B. Mitton et.al. "Interpretation of
the Rationale for Feed Modification
in SCWO Systems"
J. Electrochem. Soc., p. L59 (1996).
Currently viewing
Page last updated: 3/4/25